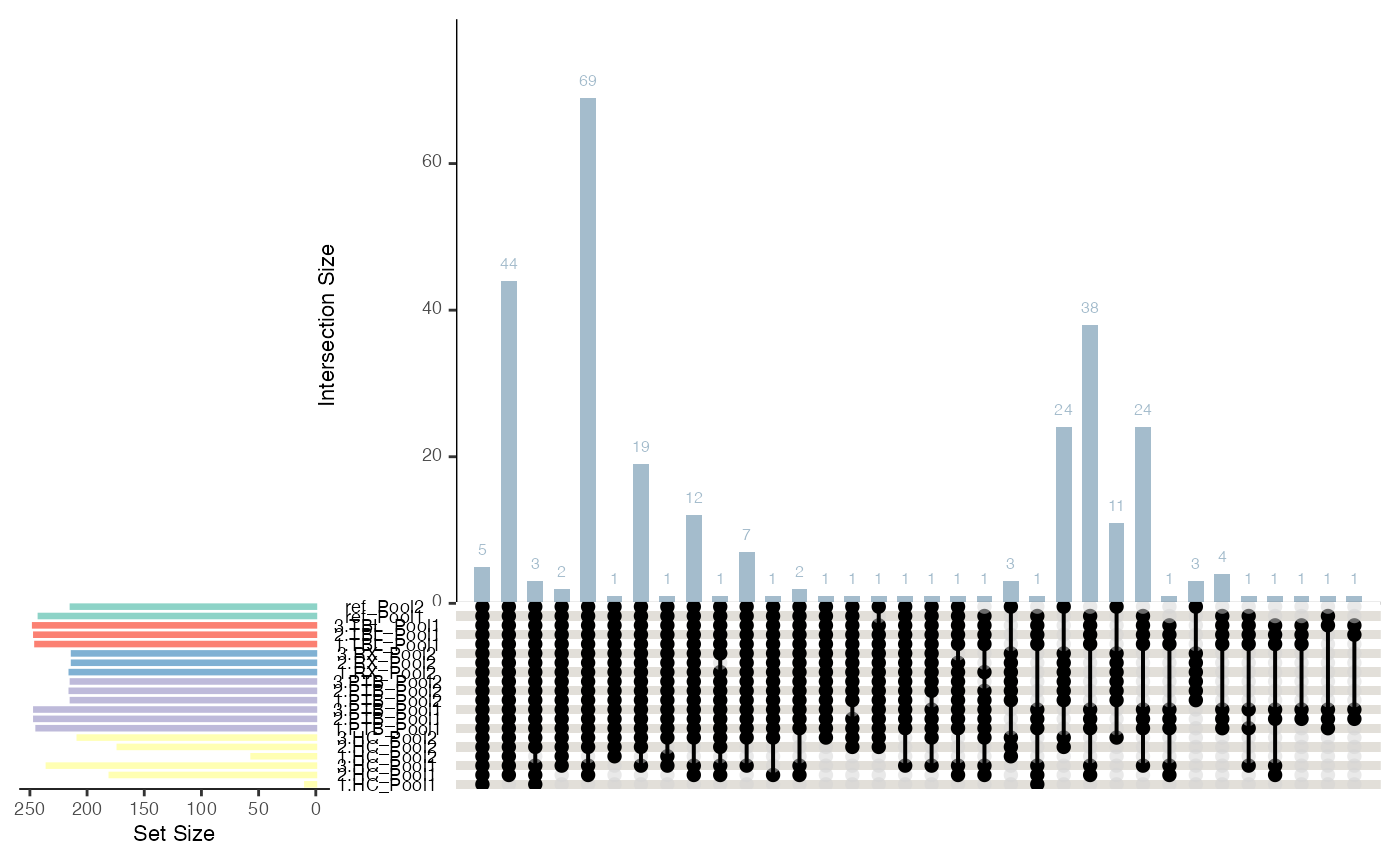
This function generates an UpSet plot from a given SummarizedExperiment object. It allows for the visualization of overlaps between sets defined by a specific column in the metadata. The function supports subsetting to reference samples and customizable color mapping.
Usage
plot_upset(
  se,
  color_by = NULL,
  label_by = NULL,
  mb.ratio = c(0.7, 0.3),
  only_refs = FALSE
)
Arguments
- se
SummarizedExperiment containing all necessary information of the proteomics data set
- color_by
String specifying the column to color the samples (If NULL, the condition column of the SummarizedExperiment object is used.)
- label_by
String specifying the column in the metadata used to label the samples for the UpSet plot
- mb.ratio
A numeric vector of length 2, specifying the barplot and matrix area ratios
- only_refs
Logical, if TRUE, only reference samples (ComRef) are included in the plot