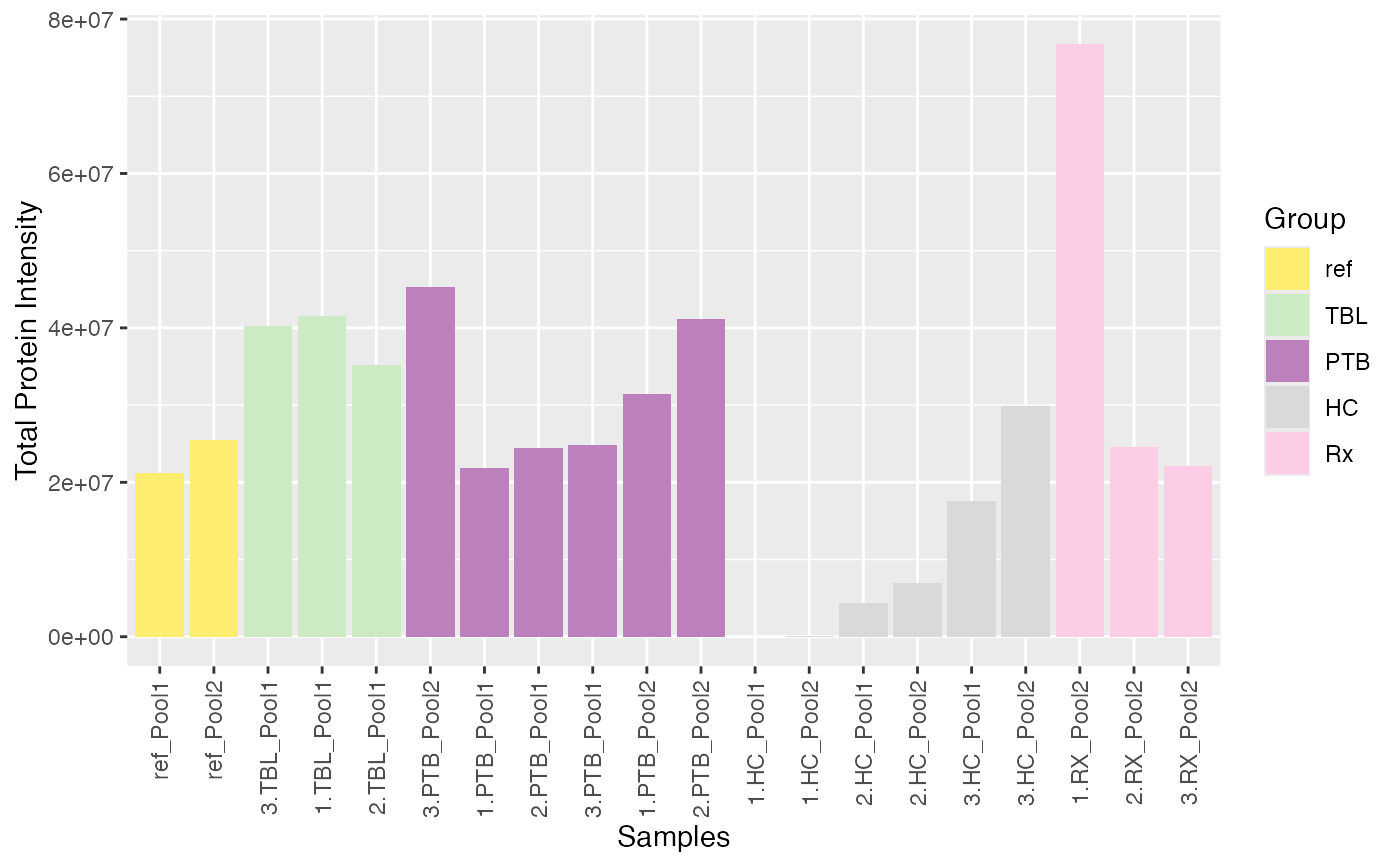
Plot total protein intensity per sample
Arguments
- se
SummarizedExperiment containing all necessary information of the proteomics data set
- ain
String which data type should be used (default raw)
- color_by
String specifying the column to color the samples (If NULL, the condition column of the SummarizedExperiment object is used. If "No", no color bar added.)
- label_by
String specifying the column to label the samples (If NULL, the labels column of the SummarizedExperiment object is used. If "No", no labeling of samples done.)
Examples
data(tuberculosis_TMT_se)
plot_tot_int_samples(tuberculosis_TMT_se, ain="raw", color_by = NULL,
                     label_by = NULL)
#> Condition of SummarizedExperiment used!
#> Label of SummarizedExperiment used!