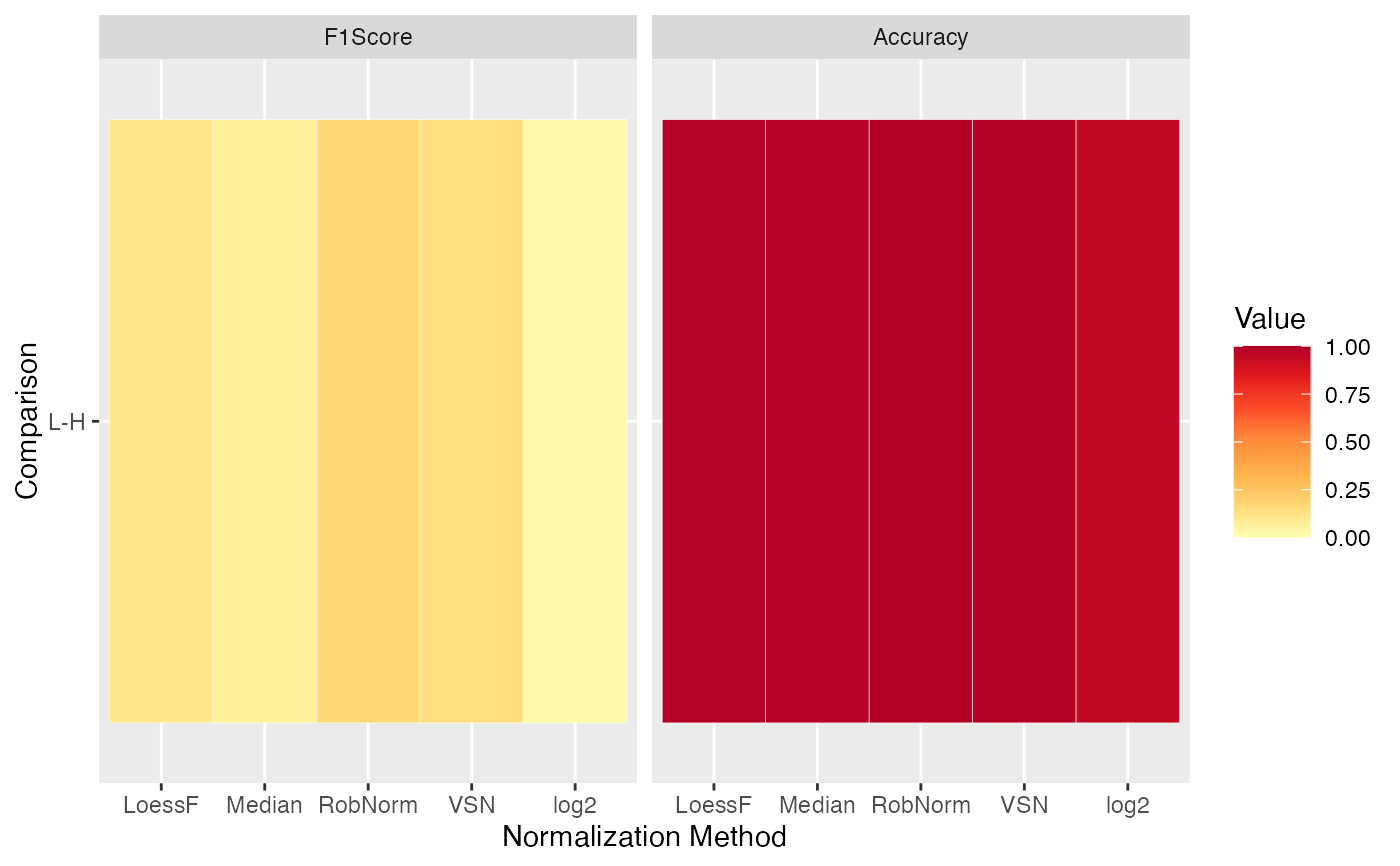
Heatmap of performance metrics for spike-in data sets
Source:R/SpikeDEPlots.R
plot_stats_spiked_heatmap.RdHeatmap of performance metrics for spike-in data sets
Usage
plot_stats_spiked_heatmap(
  stats,
  ain = NULL,
  comparisons = NULL,
  metrics = c("Accuracy", "Precision", "F1Score")
)
Arguments
- stats
data table with multiple metrics of the DE results (resulting of get_spiked_stats_DE)
- ain
Vector of strings of normalization methods to visualize (must be valid normalization methods saved in stats)
- comparisons
Vector of comparisons (must be valid comparisons saved in stats)
- metrics
vector of Strings specifying the metrics (must be colnames of stats)
Examples
data(spike_in_se)
data(spike_in_de_res)
stats <- get_spiked_stats_DE(spike_in_se, spike_in_de_res)
plot_stats_spiked_heatmap(stats, ain = NULL, comparisons = NULL,
                          metrics = c("F1Score", "Accuracy"))
#> All comparisons of stats will be visualized.
#> All normalization methods of de_res will be visualized.