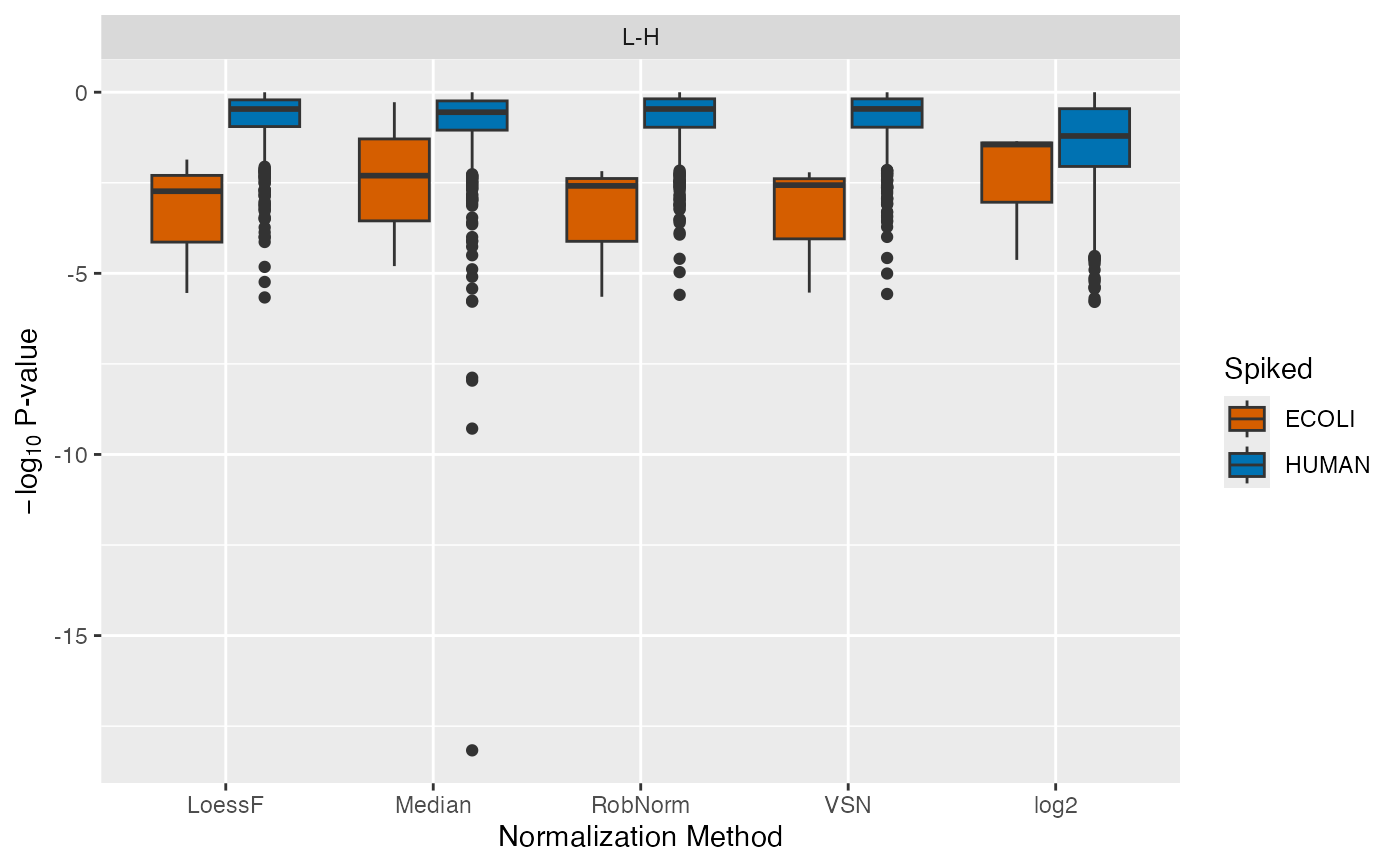
Boxplot of p-values of spike-in and background proteins for specific normalization methods and comparisons. The ground truth (calculated based on the concentrations of the spike-ins) is shown as a horizontal line.
Source:R/SpikeDEPlots.R
plot_pvalues_spiked.RdBoxplot of p-values of spike-in and background proteins for specific normalization methods and comparisons. The ground truth (calculated based on the concentrations of the spike-ins) is shown as a horizontal line.
Arguments
- se
SummarizedExperiment containing all necessary information of the proteomics data set
- de_res
data table resulting of run_DE
- ain
Vector of strings of normalization methods to visualize (must be valid normalization methods saved in stats)
- comparisons
Vector of comparisons (must be valid comparisons saved in stats)
Examples
data(spike_in_se)
data(spike_in_de_res)
plot_pvalues_spiked(spike_in_se, spike_in_de_res, ain = NULL,
                    comparisons = NULL)
#> All comparisons of de_res will be visualized.
#> All normalization methods of de_res will be visualized.
#> Warning: Removed 2225 rows containing non-finite outside the scale range
#> (`stat_boxplot()`).