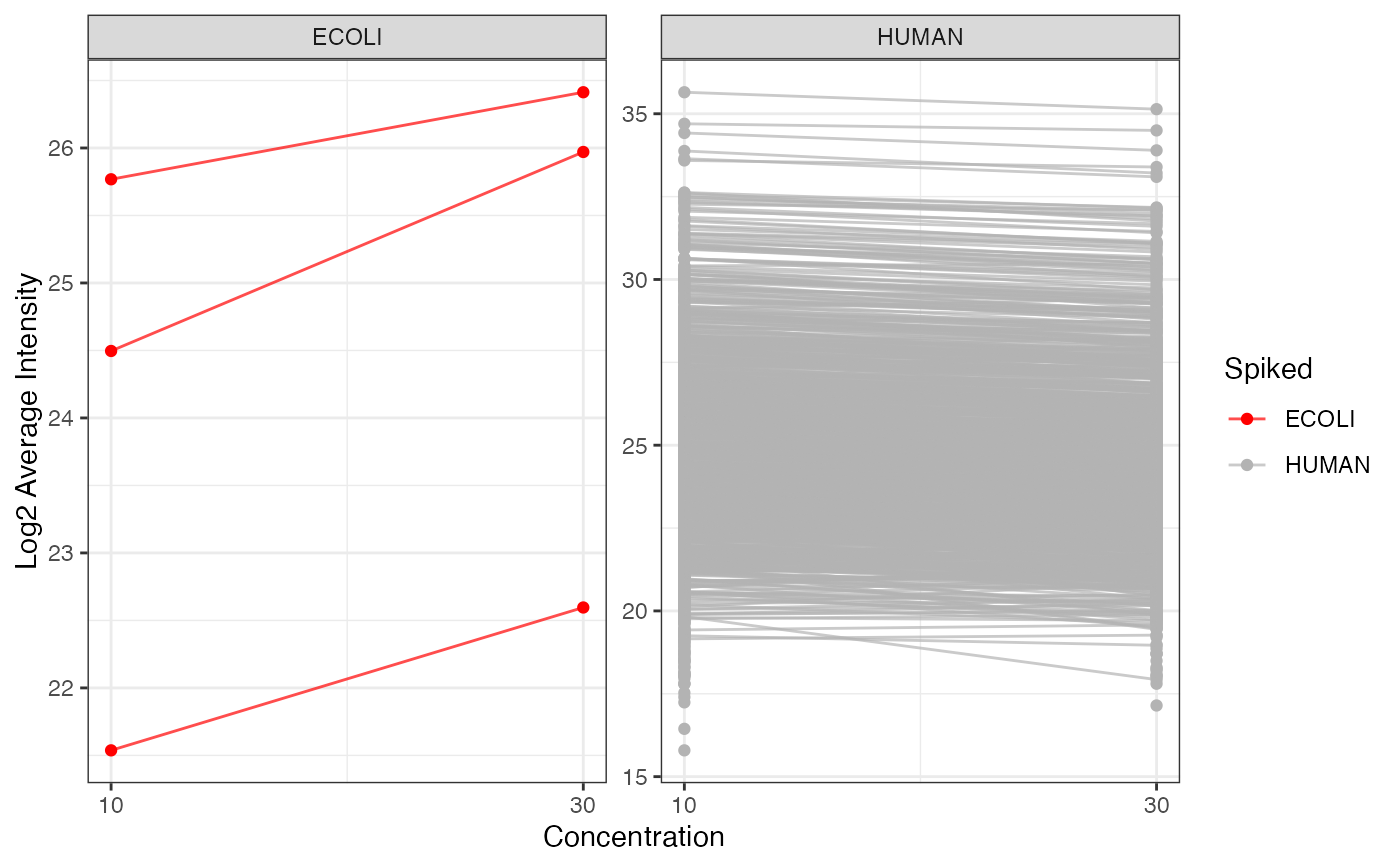
Plot profiles of the spike-in and background proteins using the log2 average protein intensities as a function of the different concentrations.
Source:R/SpikeOverview.R
plot_profiles_spiked.RdPlot profiles of the spike-in and background proteins using the log2 average protein intensities as a function of the different concentrations.
Examples
data(spike_in_se)
plot_profiles_spiked(spike_in_se, xlab = "Concentration")
#> Warning: 'measure.vars' [LFQ.intensity.H1, LFQ.intensity.H2, LFQ.intensity.H3, LFQ.intensity.L1, ...] are not all of the same type. By order of hierarchy, the molten data value column will be of type 'character'. All measure variables not of type 'character' will be coerced too. Check DETAILS in ?melt.data.table for more on coercion.
#> Warning: Removed 447 rows containing missing values or values outside the scale range
#> (`geom_point()`).
#> Warning: Removed 447 rows containing missing values or values outside the scale range
#> (`geom_line()`).