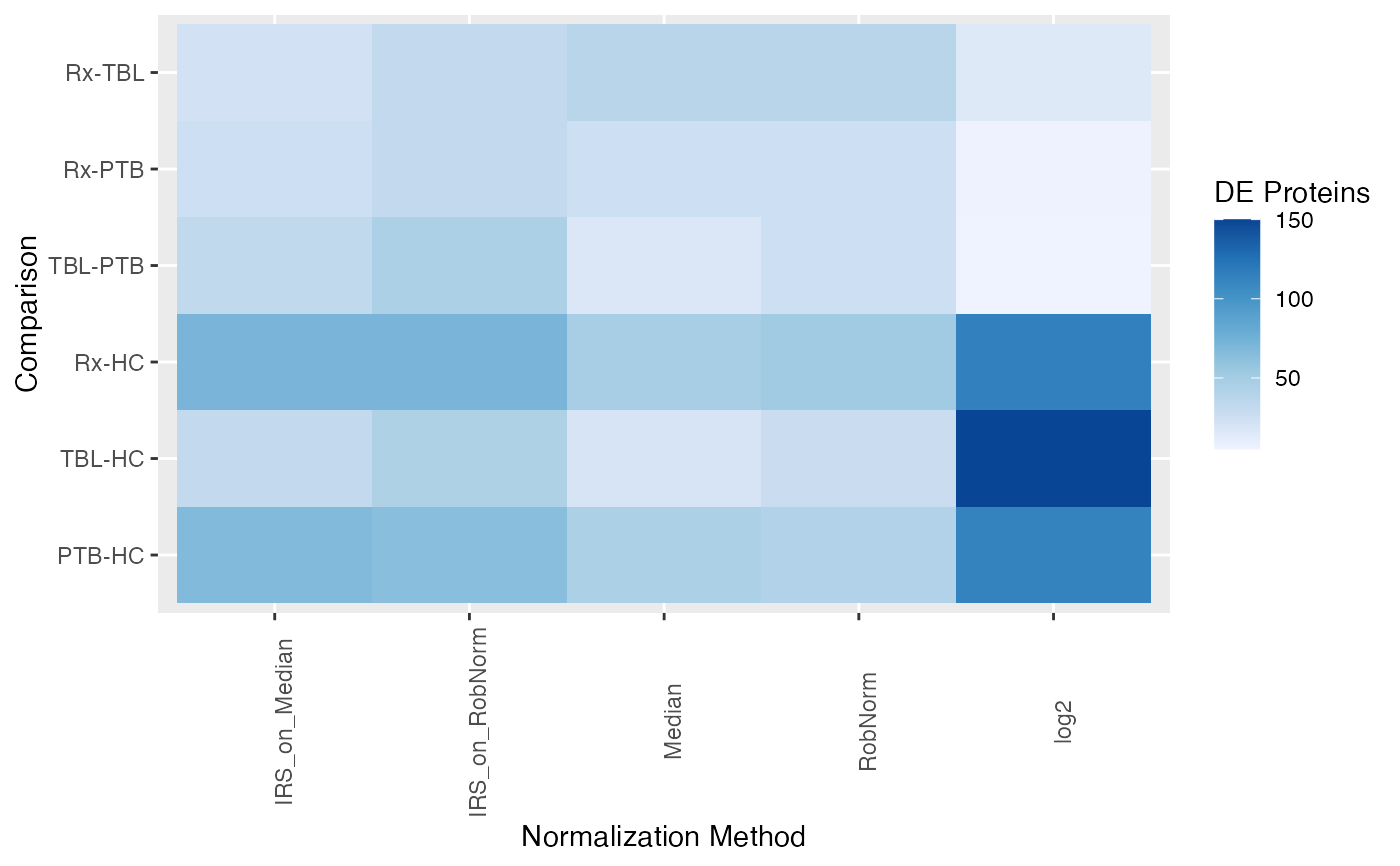
Overview heatmap plot of DE results
Usage
plot_overview_DE_tile(de_res, ain = NULL, comparisons = NULL)
Arguments
- de_res
data table resulting of run_DE
- ain
Vector of strings of normalization methods to visualize (must be valid normalization methods saved in de_res)
- comparisons
Vector of comparisons (must be valid comparisons saved in de_res)
Examples
data(tuberculosis_TMT_de_res)
plot_overview_DE_tile(tuberculosis_TMT_de_res, ain = NULL,
                      comparisons = NULL)
#> All comparisons of de_res will be visualized.
#> All normalization methods of de_res will be visualized.