Overview plots of DE results
Arguments
- de_res
data table resulting of run_DE
- ain
Vector of strings of normalization methods to visualize (must be valid normalization methods saved in de_res)
- comparisons
Vector of comparisons (must be valid comparisons saved in de_res)
- plot_type
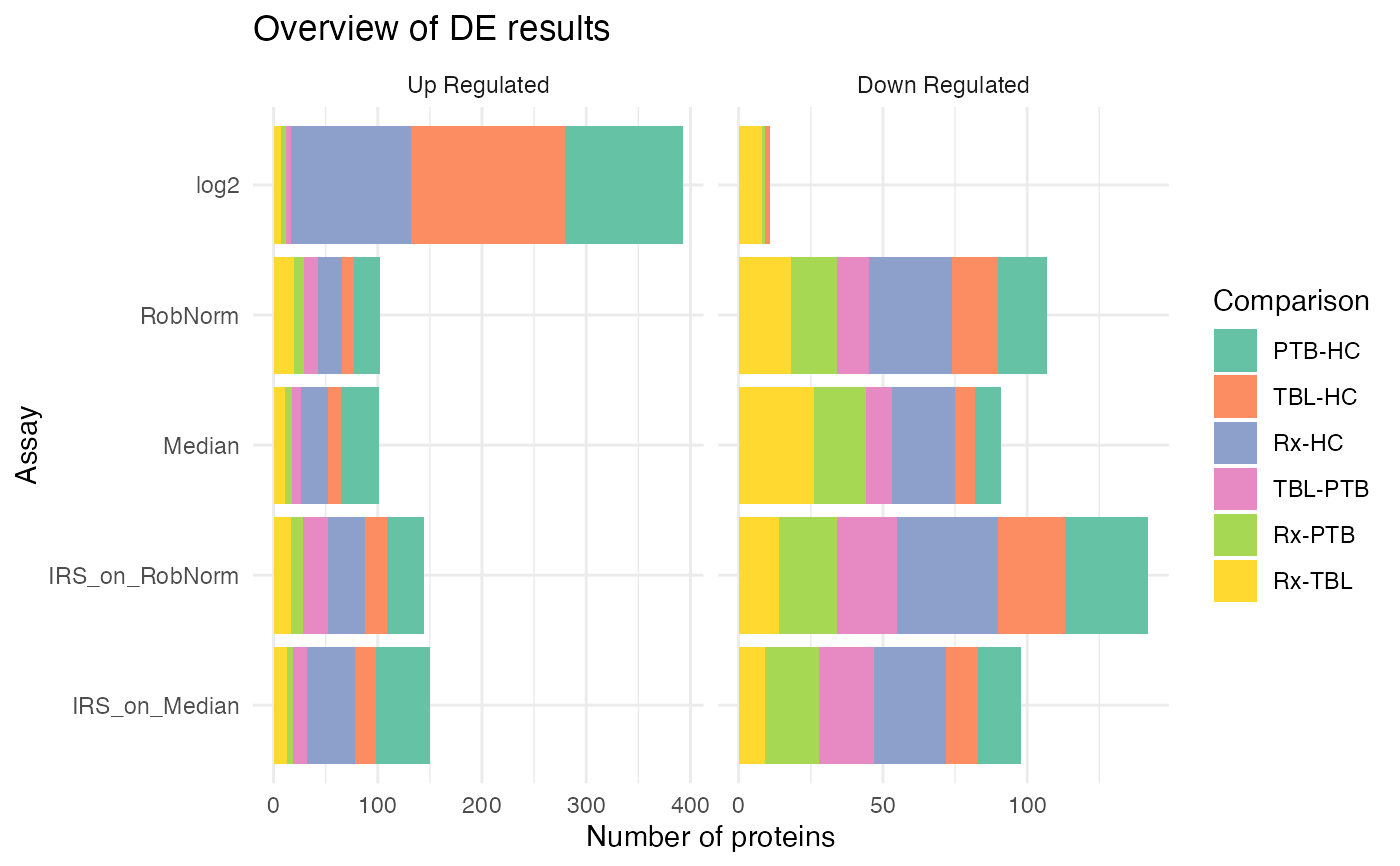
String indicating whether to plot a single plot per comparison ("single"), facet by comparison ("facet_comp"), stack the number of DE per comparison ("stacked"), or stack the number of DE per comparison but facet by up- and down-regulated ("facet_regulation")
Examples
data(tuberculosis_TMT_de_res)
plot_overview_DE_bar(tuberculosis_TMT_de_res, ain = NULL, comparisons = NULL,
                     plot_type = "facet_regulation")
#> All comparisons of de_res will be visualized.
#> All normalization methods of de_res will be visualized.