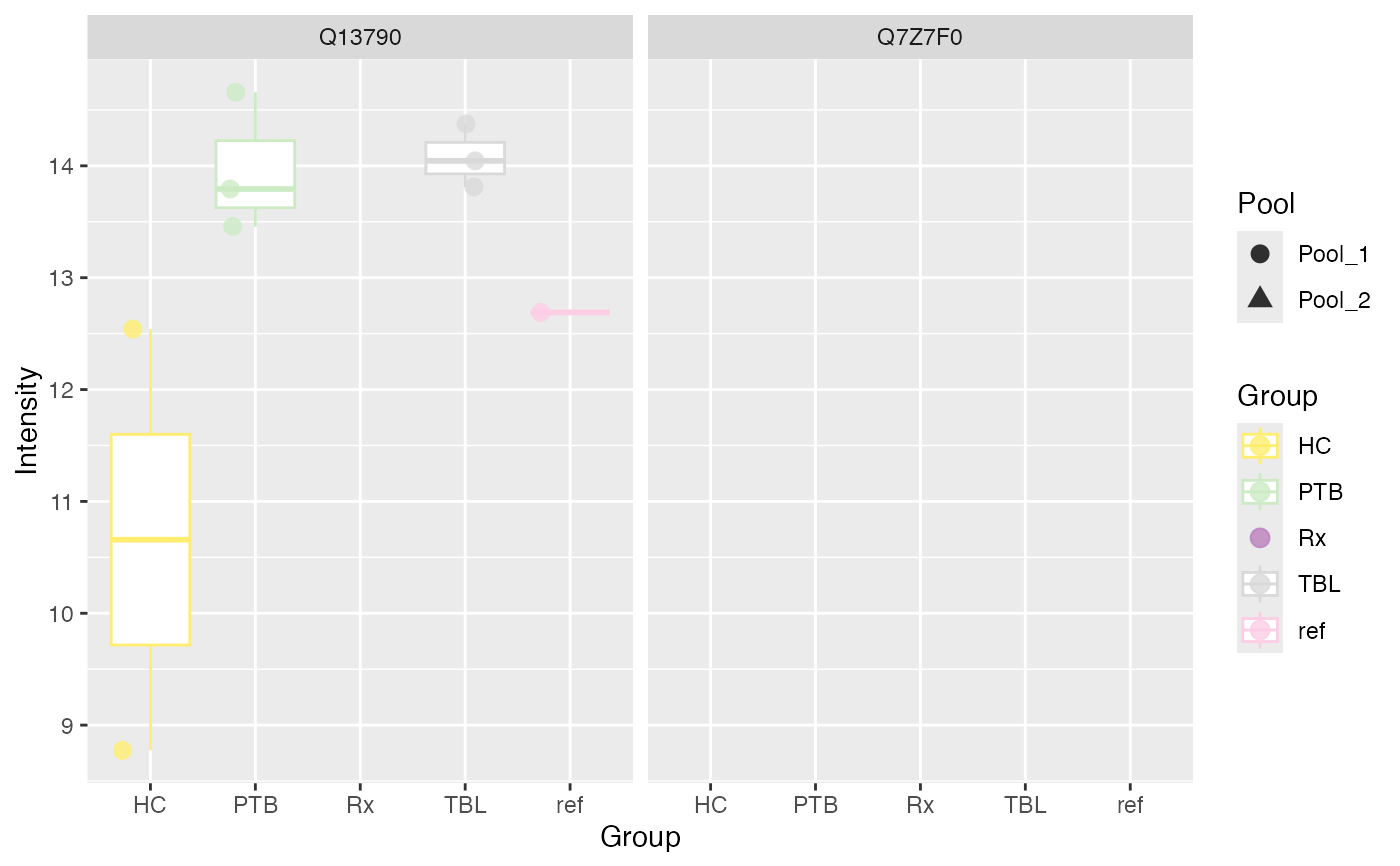
Boxplots of intensities of specific markers
Usage
plot_markers_boxplots(
  se,
  markers,
  ain = NULL,
  id_column = "Protein.IDs",
  color_by = NULL,
  shape_by = NULL,
  facet_norm = TRUE,
  facet_marker = FALSE
)
Arguments
- se
SummarizedExperiment containing all necessary information of the proteomics data set
- markers
Vector of the IDs of the markers to plot
- ain
Vector of strings of normalization methods to visualize (must be valid normalization methods saved in de_res)
- id_column
String specifying the column of the rowData of the SummarizedExperiment object which includes the IDs of the markers
- color_by
String specifying the column to color the samples (If NULL, the condition column of the SummarizedExperiment object is used. If "No", no color bar added.)
- shape_by
String specifying the column to shape the samples (If NULL or "No", no shaping of samples is done.)
- facet_norm
Boolean indicating whether to facet by normalization method (TRUE) or not (FALSE)
- facet_marker
Boolean indicating whether to facet by comparison (TRUE) or not (FALSE). Only valid if facet_norm = FALSE.
Examples
data(tuberculosis_TMT_se)
plot_markers_boxplots(tuberculosis_TMT_se, markers = c("Q7Z7F0", "Q13790"),
                     ain = c("log2"), id_column = "Protein.IDs",
                     color_by = NULL,
                     shape_by = "Pool",
                     facet_norm = FALSE,
                     facet_marker = TRUE)
#> Condition of SummarizedExperiment used!
#> $log2
#> Warning: Removed 31 rows containing non-finite outside the scale range
#> (`stat_boxplot()`).
#> Warning: Removed 31 rows containing missing values or values outside the scale range
#> (`geom_point()`).

#>
#>