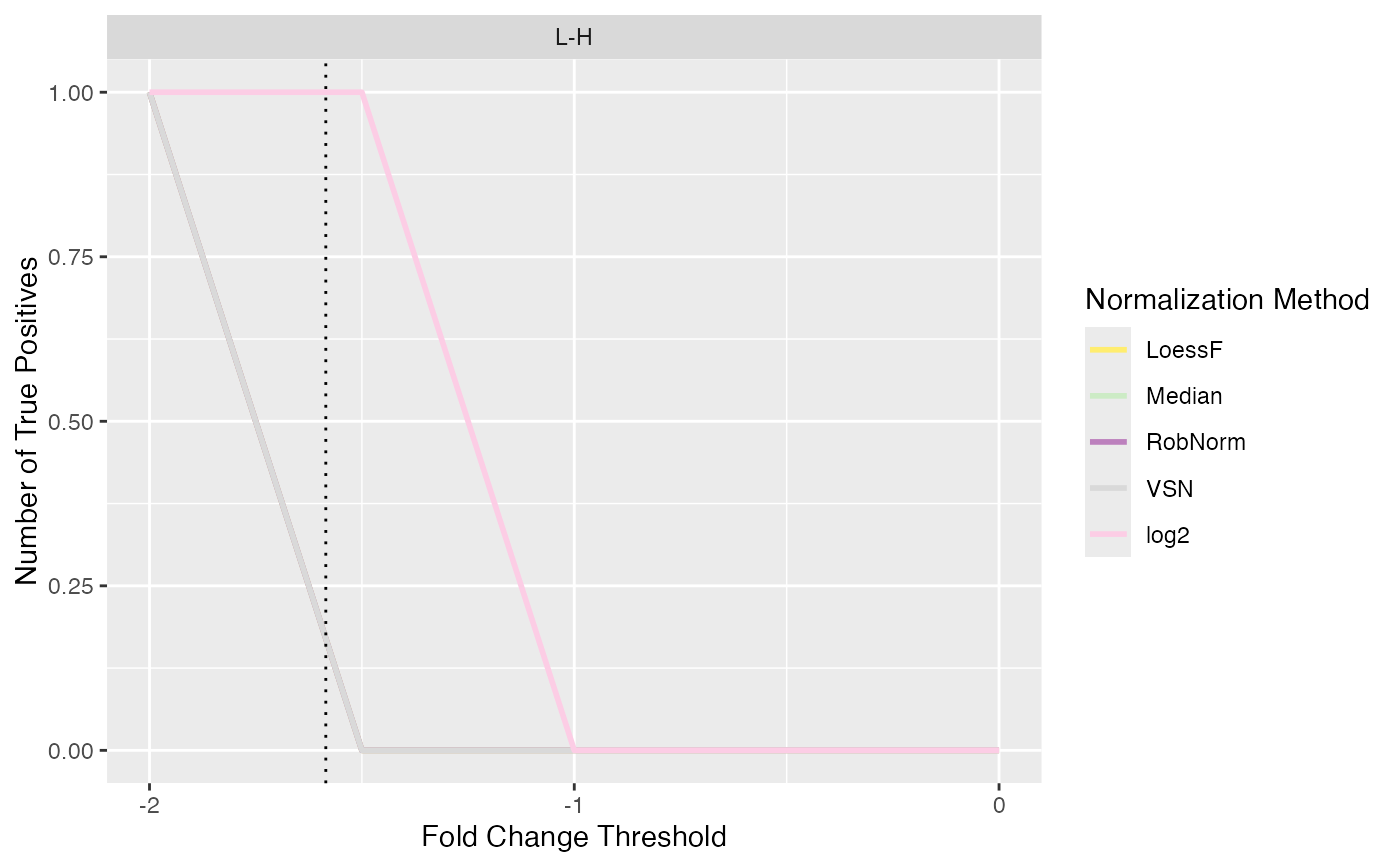
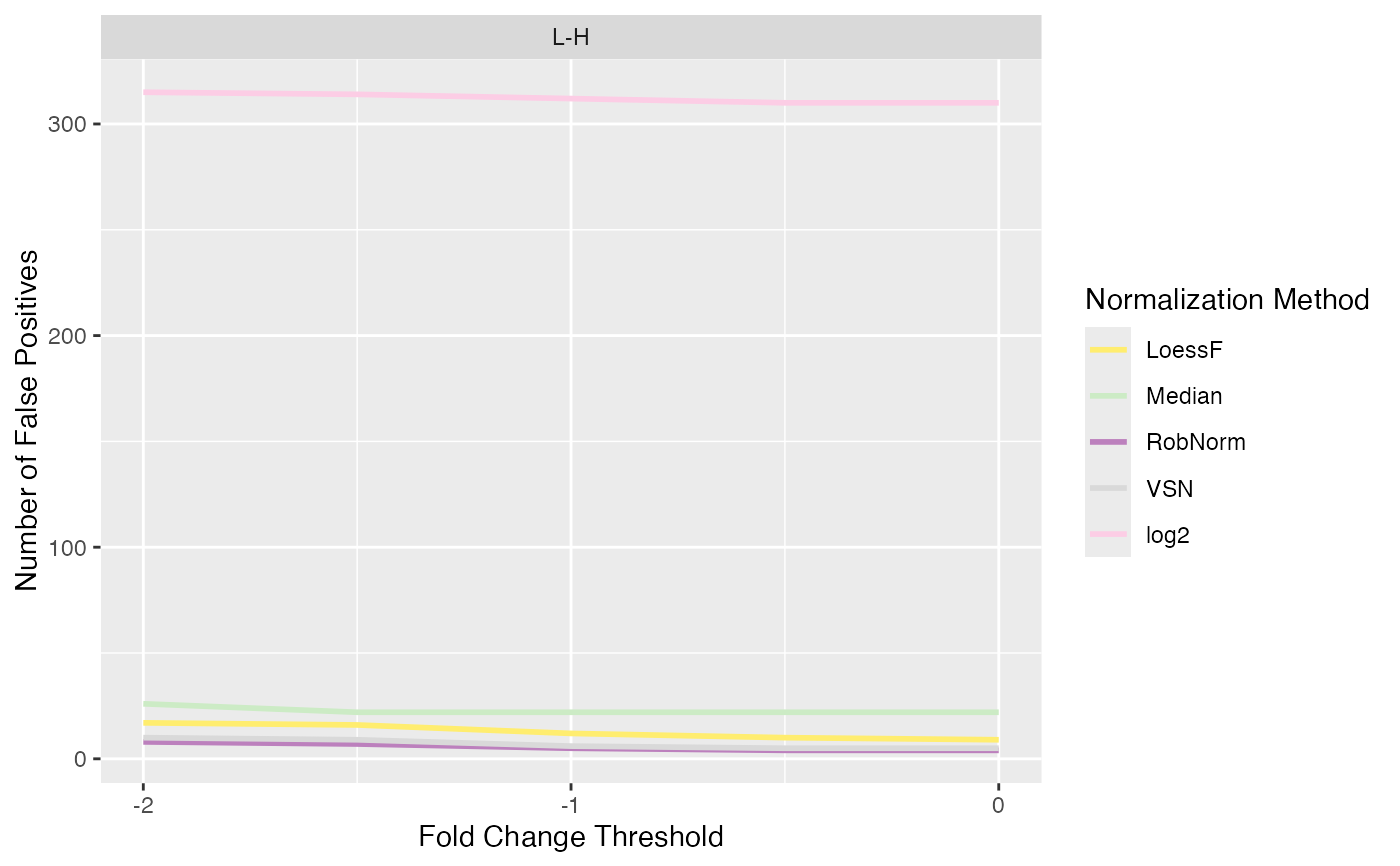
Line plot of number of true and false positives when applying different logFC thresholds
Source:R/SpikeDEPlots.R
plot_logFC_thresholds_spiked.RdLine plot of number of true and false positives when applying different logFC thresholds
Usage
plot_logFC_thresholds_spiked(
  se,
  de_res,
  condition,
  ain = NULL,
  comparisons = NULL,
  nrow = 2,
  alpha = 0.05
)
Arguments
- se
SummarizedExperiment containing all necessary information of the proteomics data set
- de_res
data table resulting of run_DE
- condition
column name of condition (if NULL, condition saved in SummarizedExperiment will be taken)
- ain
Vector of strings of normalization methods to visualize (must be valid normalization methods saved in stats)
- comparisons
Vector of comparisons (must be valid comparisons saved in stats)
- nrow
number of rows for facet wrap
- alpha
threshold for adjusted p-values
Examples
data(spike_in_se)
data(spike_in_de_res)
plot_logFC_thresholds_spiked(spike_in_se, spike_in_de_res,
                             condition = "Condition", ain = NULL,
                             comparisons = NULL, nrow = 2, alpha = 0.05)
#> All comparisons of de_res will be visualized.
#> All normalization methods of de_res will be visualized.
#> $TP

#>
#> $FP

#>
#> $FP
 #>
#>