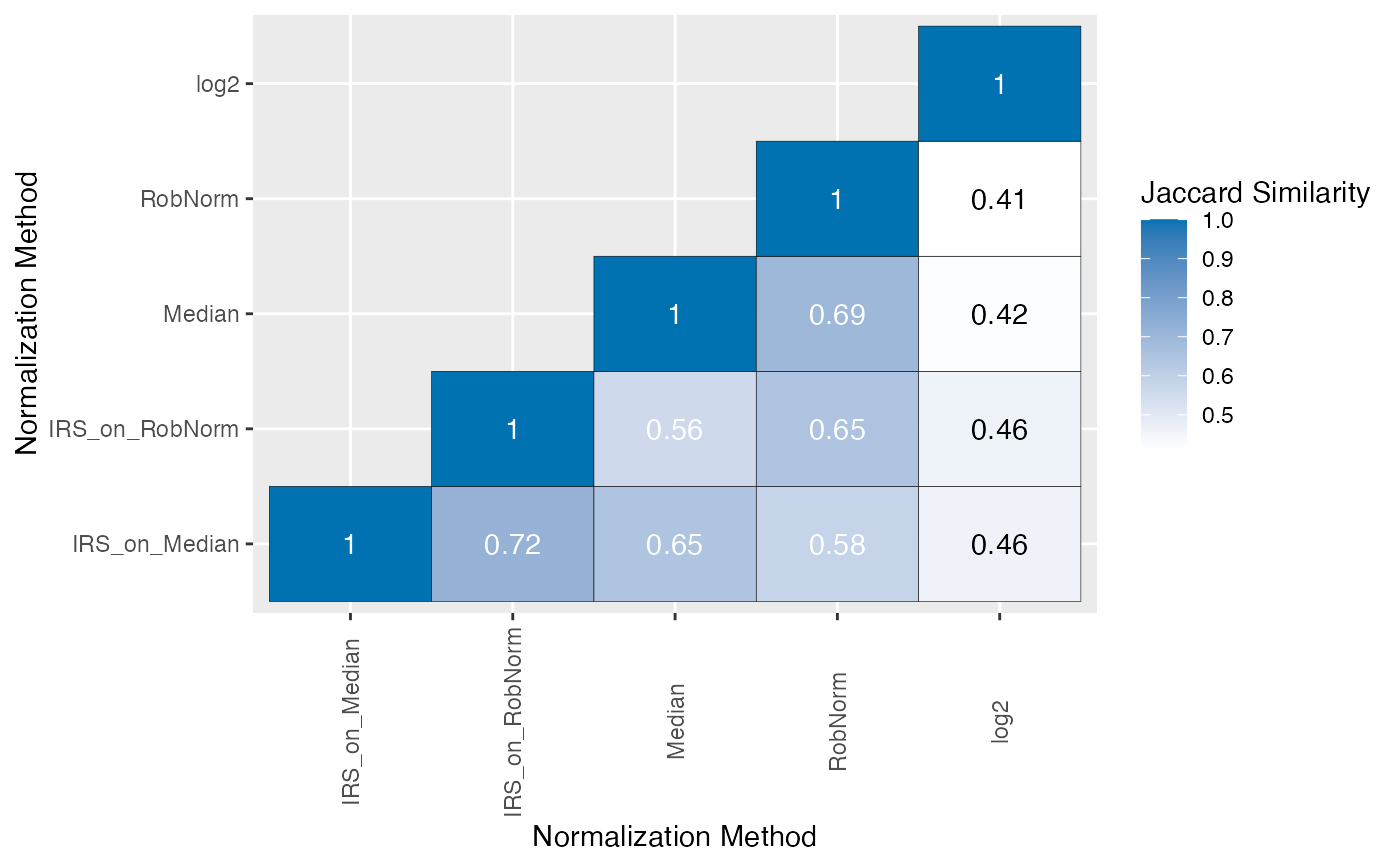
Jaccard similarity heatmap of DE proteins of the different normalization methods
Source:R/DEIntersection.R
plot_jaccard_heatmap.RdJaccard similarity heatmap of DE proteins of the different normalization methods
Arguments
- de_res
data table resulting of run_DE
- ain
Vector of strings of normalization methods to visualize (must be valid normalization methods saved in de_res)
- comparisons
Vector of comparisons (must be valid comparisons saved in de_res)
- plot_type
String indicating whether to plot a single plot per comparison ("single"), facet by comparison ("facet_comp"), or include all comparisons in a single plot ("all")
Examples
data(tuberculosis_TMT_de_res)
plot_jaccard_heatmap(tuberculosis_TMT_de_res, ain = NULL,
                    comparisons = NULL, plot_type = "all")
#> All comparisons of de_res will be visualized.
#> All normalization methods of de_res will be visualized.