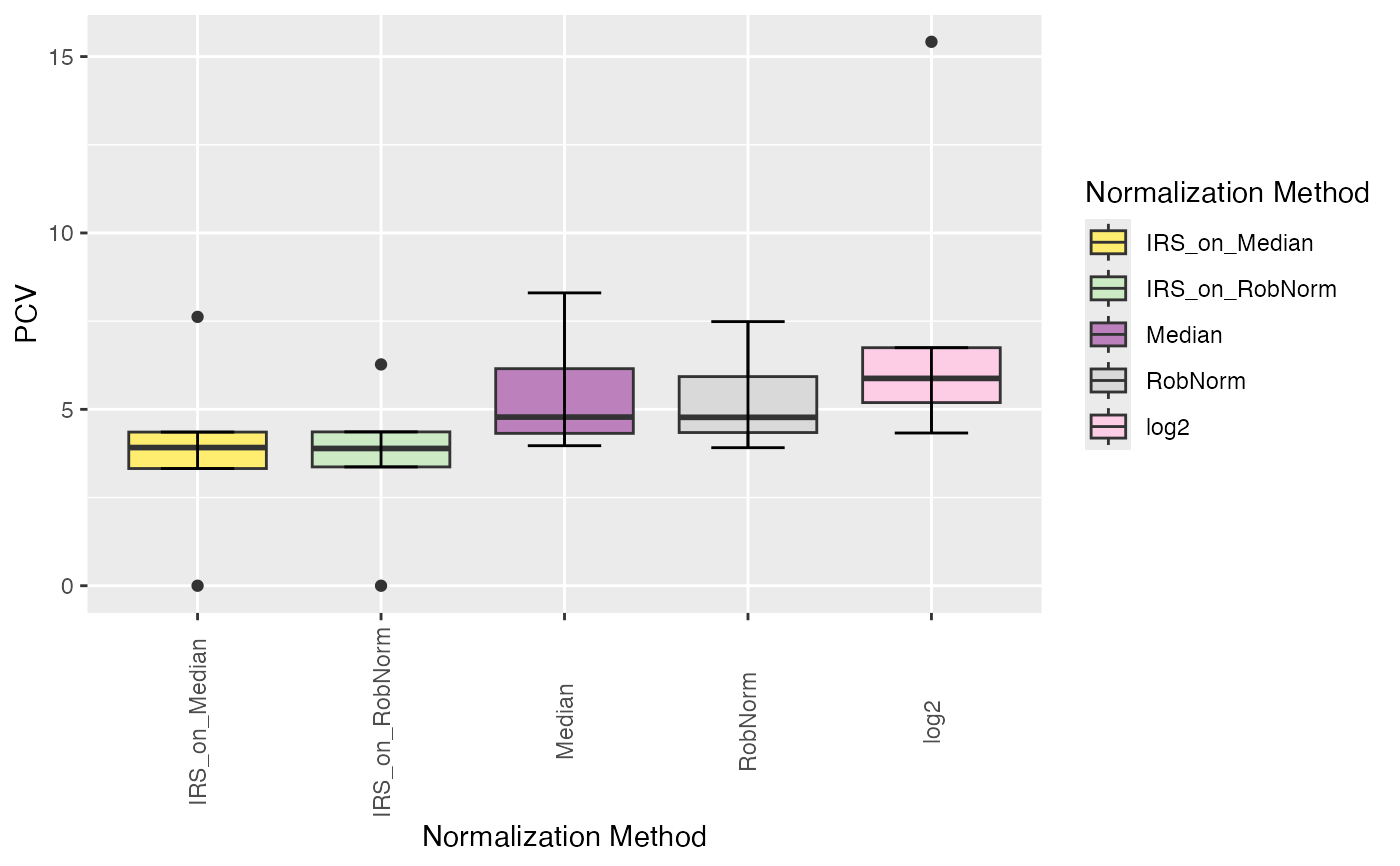
Plot intragroup pooled coefficient of variation (PCV) of the normalized data
Source:R/NormalizationPlots.R
plot_intragroup_PCV.RdPlot intragroup pooled coefficient of variation (PCV) of the normalized data
Arguments
- se
SummarizedExperiment containing all necessary information of the proteomics data set
- ain
Vector of strings which assay should be used as input (default NULL). If NULL then all normalization of the se object are plotted next to each other.
- condition
Column name of condition (if NULL, condition saved in SummarizedExperiment will be taken)
- diff
Boolean indicating whether to visualize the reduction of intragroup variation (PCV) compared to "log" (TRUE) or a normal boxplot of intragroup variation (PCV) for each normalization method (FALSE).
Examples
data(tuberculosis_TMT_se)
plot_intragroup_PCV(tuberculosis_TMT_se, ain = NULL,
                            condition = NULL, diff = FALSE)
#> All assays of the SummarizedExperiment will be used.
#> Condition of SummarizedExperiment used!