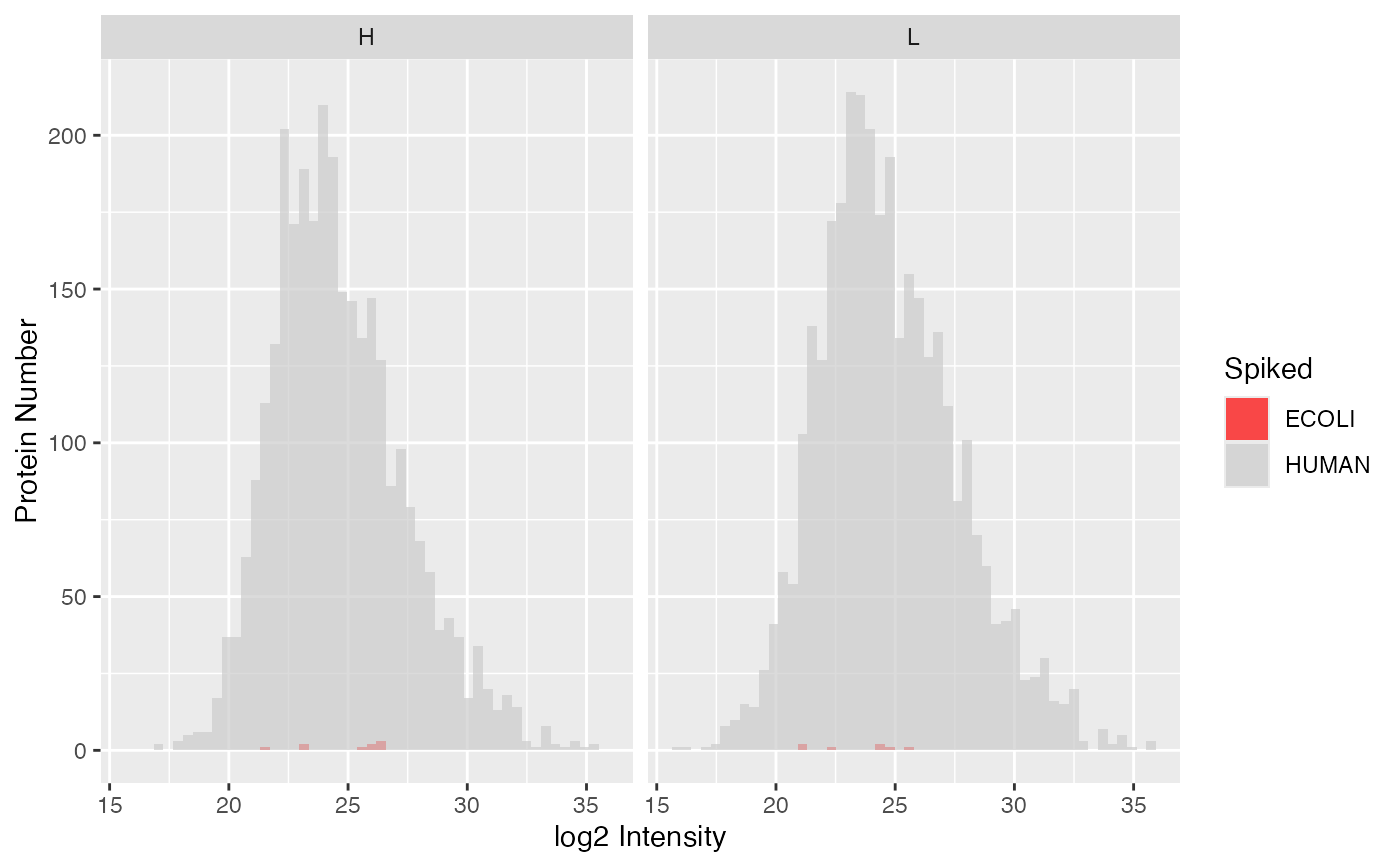
Plot histogram of the spike-in and background protein intensities per condition.
Source:R/SpikeOverview.R
plot_histogram_spiked.RdPlot histogram of the spike-in and background protein intensities per condition.
Examples
data(spike_in_se)
plot_histogram_spiked(spike_in_se, condition = NULL)
#> Condition of SummarizedExperiment used!
#> Warning: Removed 2643 rows containing non-finite outside the scale range (`stat_bin()`).