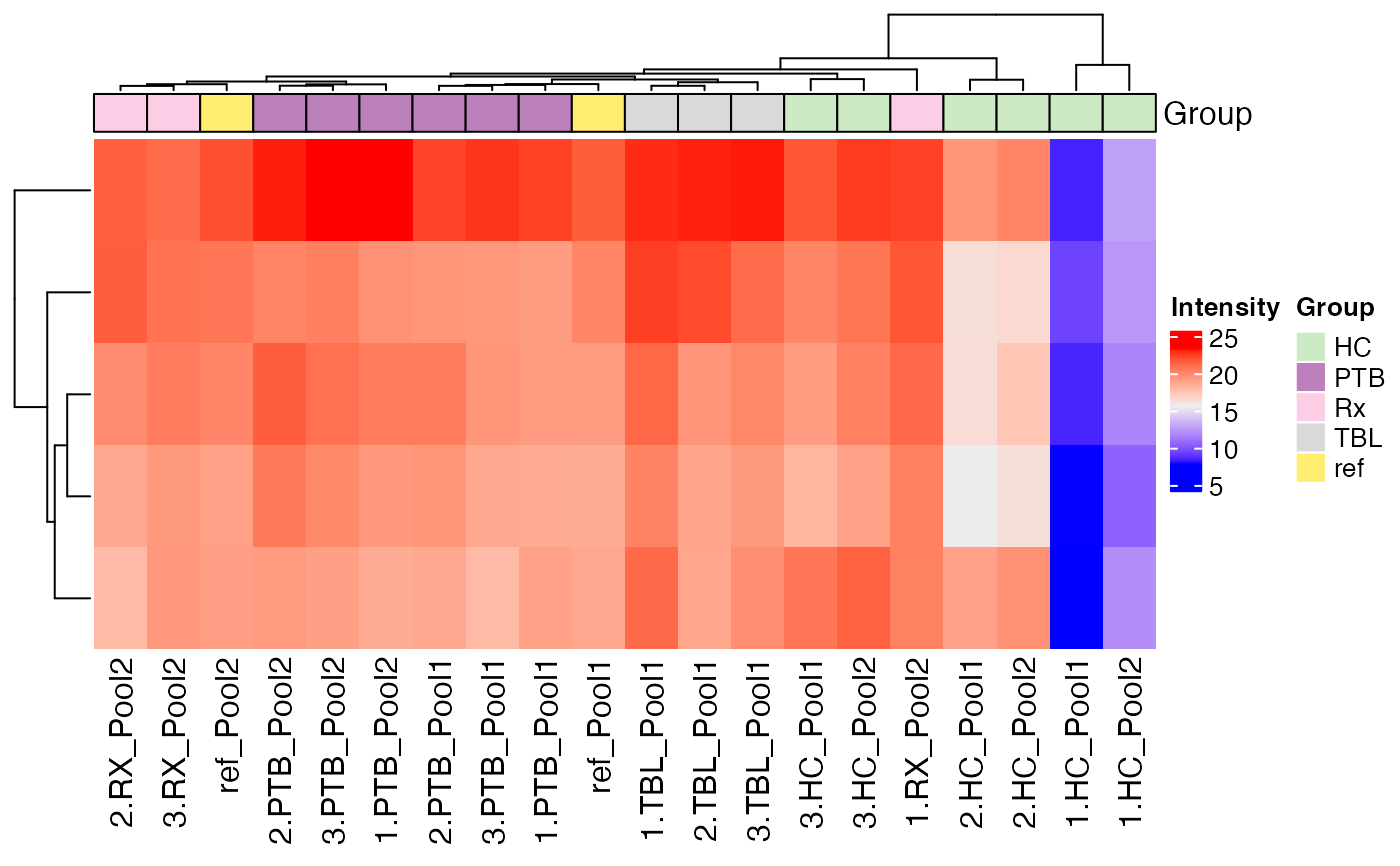
Plot a heatmap of the sample intensities with optional column annotations for a selection of normalization methods
Source:R/GetOverview.R
plot_heatmap.RdPlot a heatmap of the sample intensities with optional column annotations for a selection of normalization methods
Usage
plot_heatmap(
  se,
  ain = NULL,
  color_by = c("Group", "Pool"),
  label_by = NULL,
  only_refs = FALSE
)
Arguments
- se
SummarizedExperiment containing all necessary information of the proteomics data set
- ain
Vector of strings which assay should be used as input (default NULL). If NULL then all normalization of the se object are plotted next to each other.
- color_by
Vector of strings specifying the columns to color the samples (If NULL, the condition column of the SummarizedExperiment object is used. If "No", no color bars added.)
- label_by
String specifying the column in the metadata used to label the samples for the UpSet plot
- only_refs
Logical, if TRUE, only reference samples (ComRef) are included in the plot