Plot the densities of the normalized data
Arguments
- se
SummarizedExperiment containing all necessary information of the proteomics data set
- ain
Vector of strings which assay should be used as input (default NULL). If NULL then all normalization of the se object are plotted next to each other.
- color_by
String specifying the column to color the samples (If NULL, the condition column of the SummarizedExperiment object is used. If "No", no color bar added.)
- facet_norm
Boolean specifying whether to facet by normalization methods (default TRUE). If FALSE, list of plots of the different normalized data is returned.
- ncol
Number of columns in plot (for faceting)
Examples
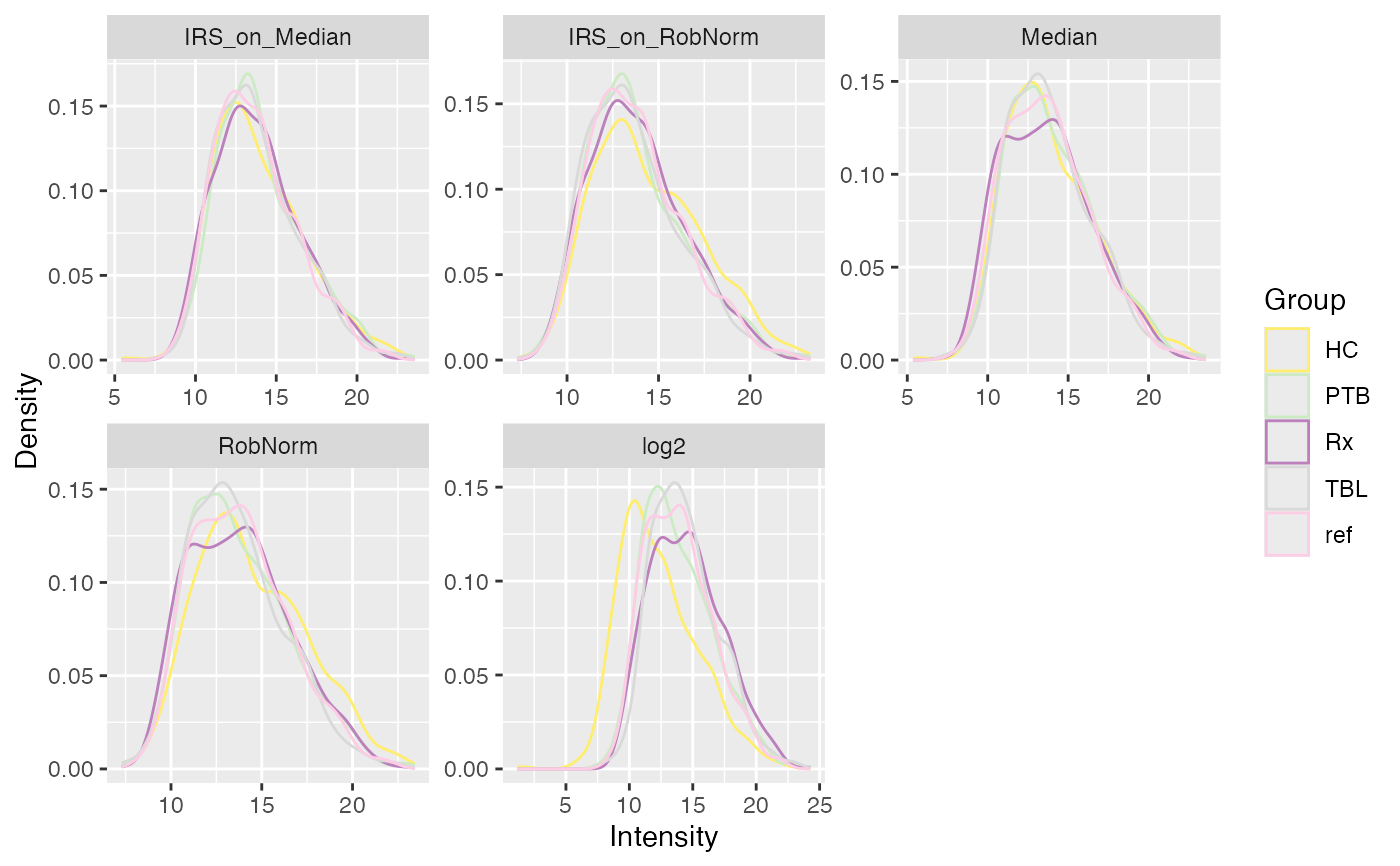
data(tuberculosis_TMT_se)
plot_densities(tuberculosis_TMT_se, ain = NULL, color_by = NULL,
facet_norm = TRUE, ncol = 3)
#> All assays of the SummarizedExperiment will be used.
#> Condition of SummarizedExperiment used!
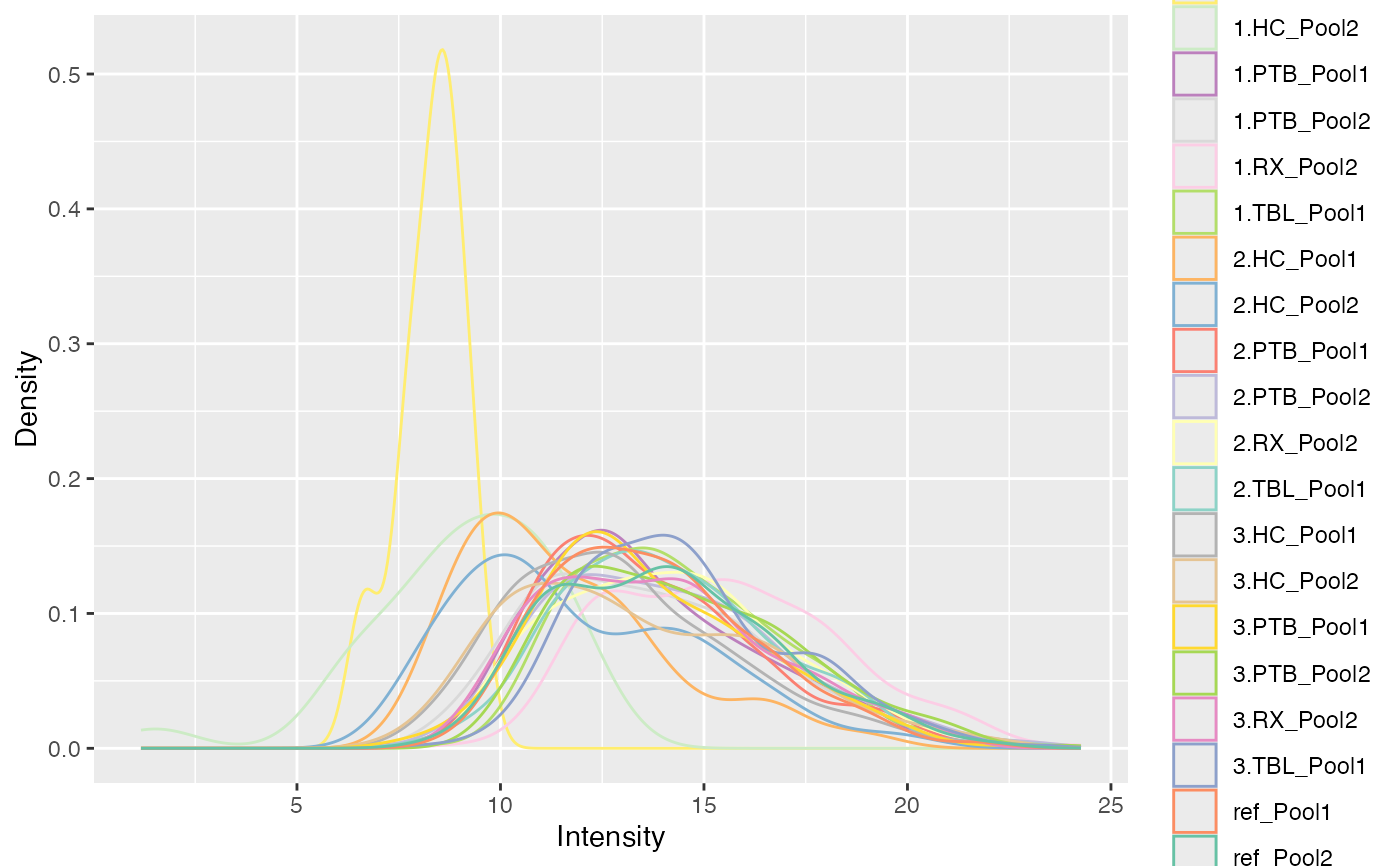
 plot_densities(tuberculosis_TMT_se, ain = c("log2", "IRS_on_RobNorm"),
color_by = "Label",
facet_norm = FALSE)
#> $log2
plot_densities(tuberculosis_TMT_se, ain = c("log2", "IRS_on_RobNorm"),
color_by = "Label",
facet_norm = FALSE)
#> $log2
 #>
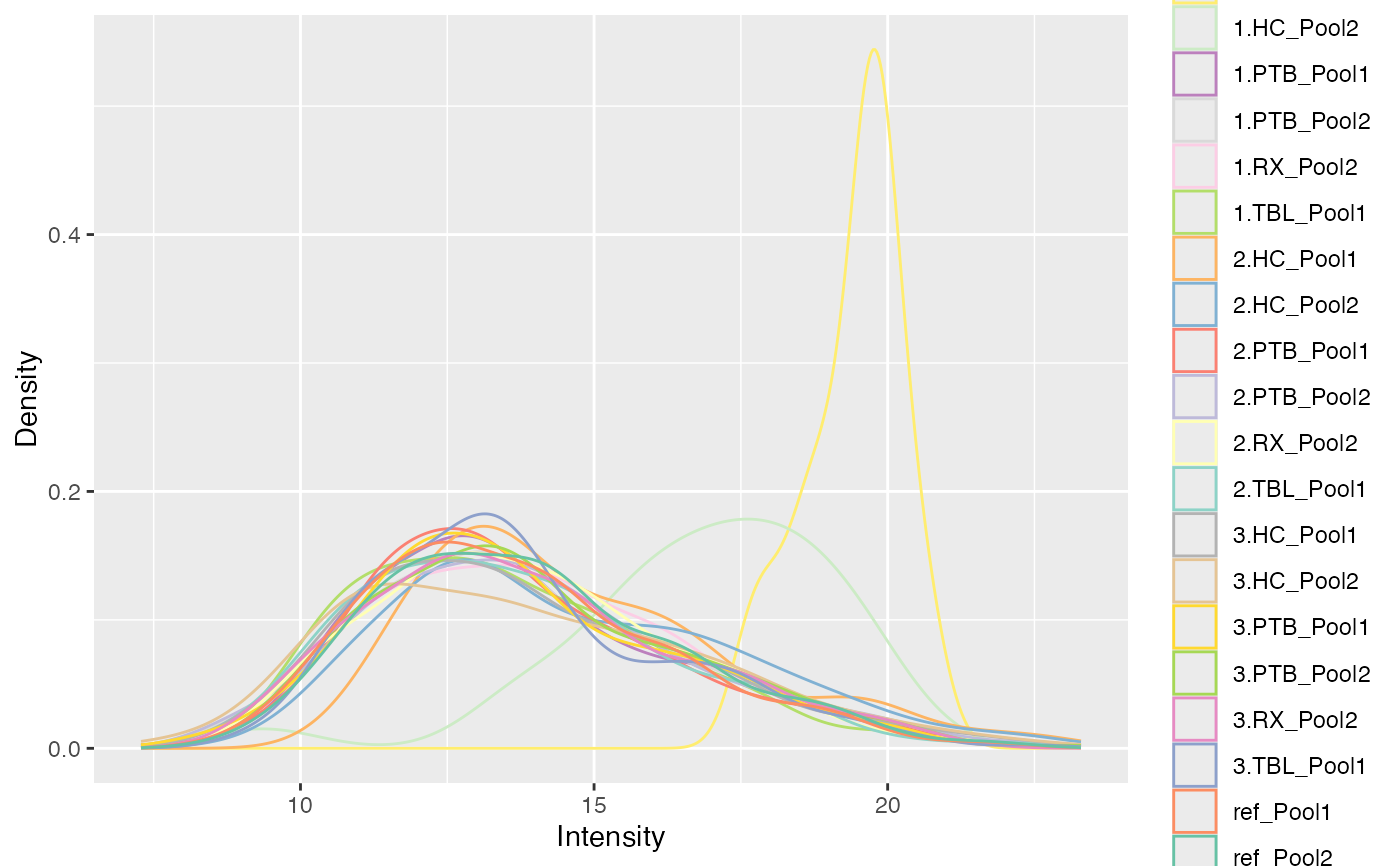
#> $IRS_on_RobNorm
#>
#> $IRS_on_RobNorm
 #>
#>