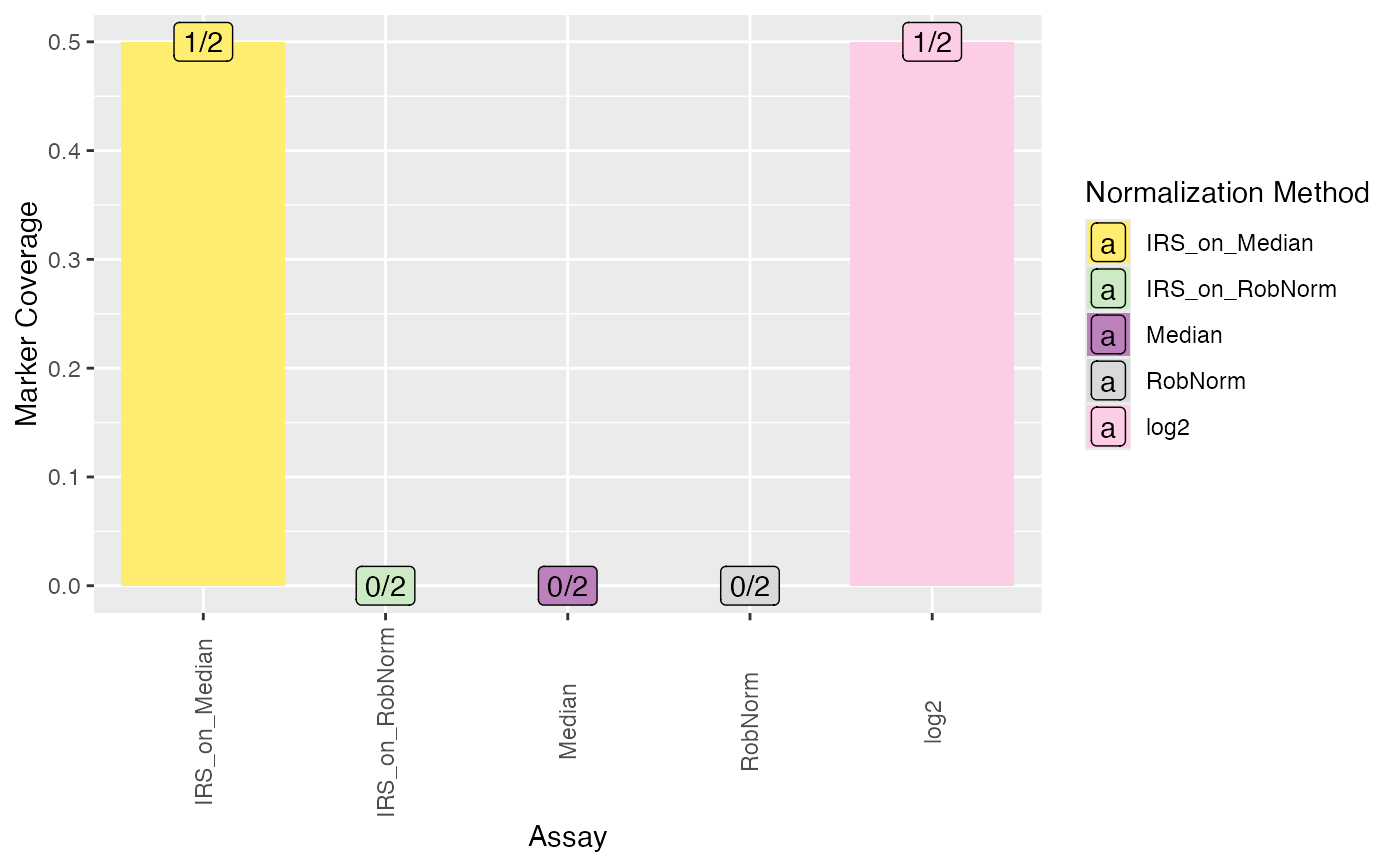
Barplot of coverage of DE markers per normalization method in any comparison. (If you want to have a look at a specific comparison, just subset the de_res data table before plotting.)
Source:R/DEPlots.R
plot_coverage_DE_markers.RdBarplot of coverage of DE markers per normalization method in any comparison. (If you want to have a look at a specific comparison, just subset the de_res data table before plotting.)
Arguments
- se
SummarizedExperiment containing all necessary information of the proteomics data set
- de_res
data table resulting of run_DE
- ain
Vector of strings of normalization methods to visualize (must be valid normalization methods saved in de_res)
- markers
vector of the IDs of the markers to plot
- id_column
String specifying the column of the rowData of the SummarizedExperiment object which includes the IDs of the markers
Examples
data(tuberculosis_TMT_se)
data(tuberculosis_TMT_de_res)
plot_coverage_DE_markers(tuberculosis_TMT_se, tuberculosis_TMT_de_res,
                          ain = NULL, markers = c("Q7Z7F0", "Q13790"),
                          id_column = "Protein.IDs")
#> All assays of the SummarizedExperiment will be used.
#> All comparisons of de_res will be visualized.
#> Warning: raw: not valid normalization methods. Only valid normalization methods will be visualized.