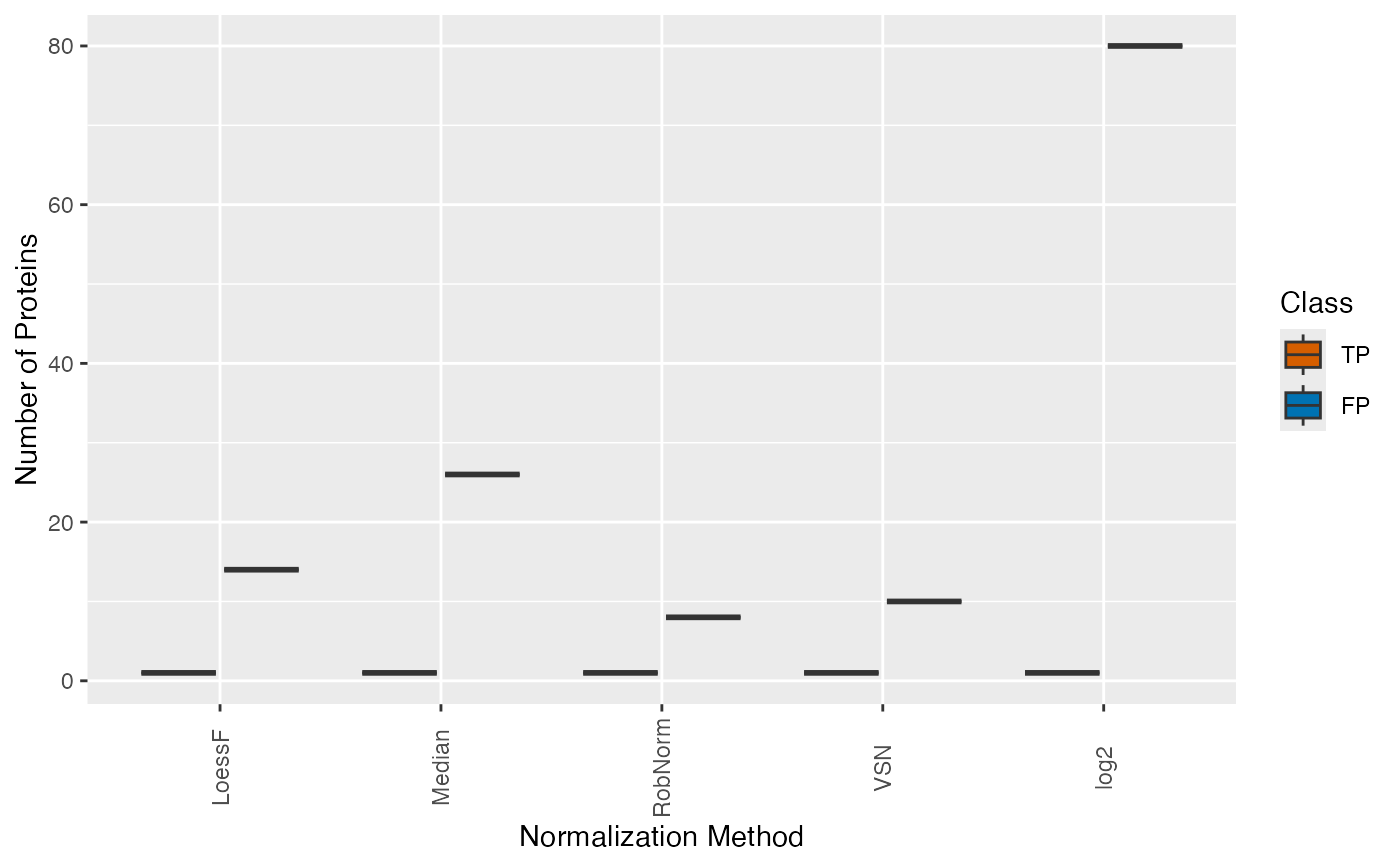
Boxplot of true and false positives for specific comparisons and normalization methods
Source:R/SpikeDEPlots.R
plot_TP_FP_spiked_box.RdBoxplot of true and false positives for specific comparisons and normalization methods
Examples
data(spike_in_se)
data(spike_in_de_res)
stats <- get_spiked_stats_DE(spike_in_se, spike_in_de_res)
plot_TP_FP_spiked_box(stats, ain = NULL, comparisons = NULL)
#> All comparisons of stats will be visualized.
#> All normalization methods of de_res will be visualized.