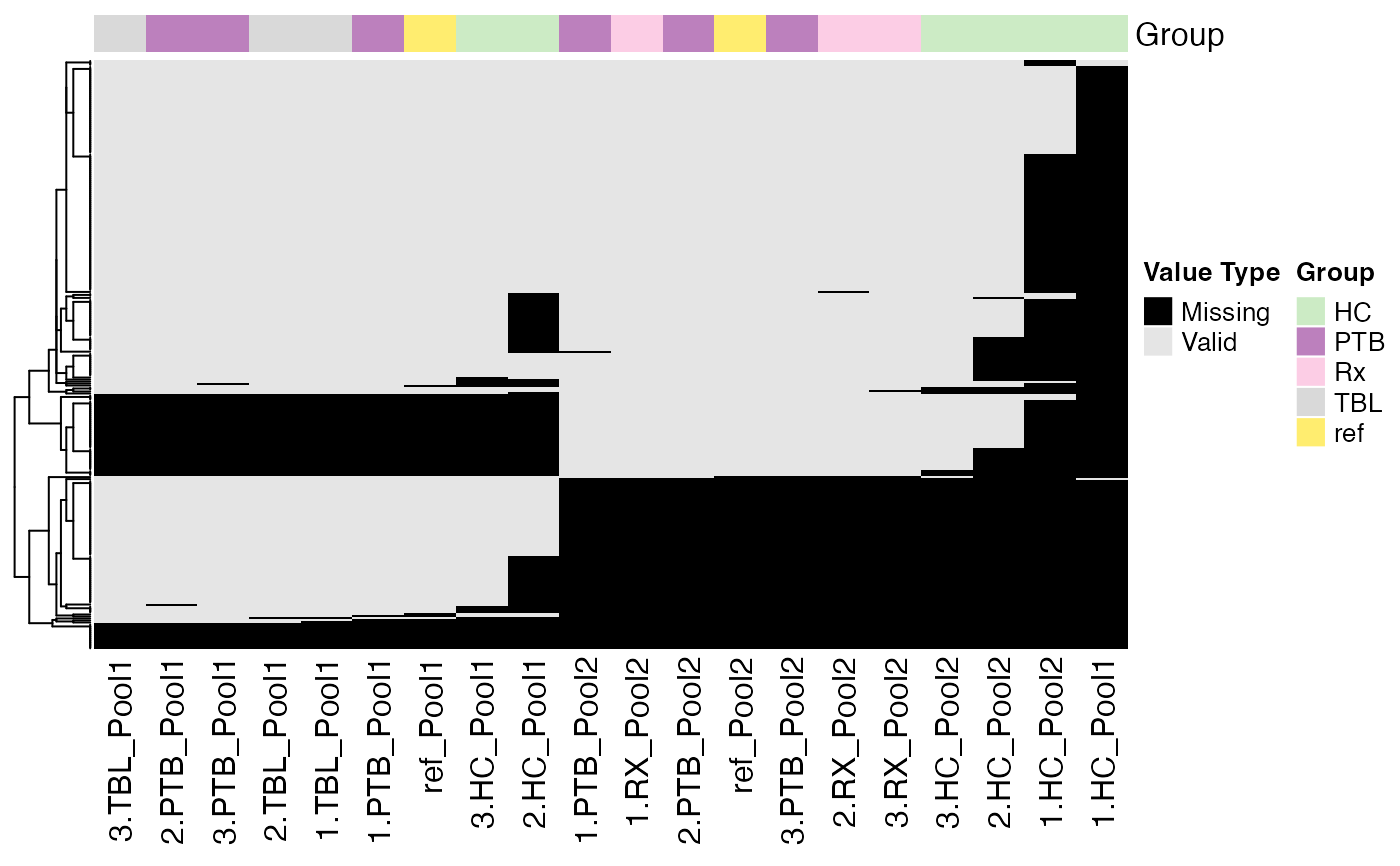
Plot heatmap of the NA pattern
Usage
plot_NA_heatmap(
  se,
  color_by = NULL,
  label_by = NULL,
  cluster_samples = TRUE,
  cluster_proteins = TRUE,
  show_row_dend = TRUE,
  show_column_dend = FALSE,
  col_vector = NULL
)
Arguments
- se
SummarizedExperiment containing all necessary information of the proteomics data set
- color_by
String specifying the column to color the samples (If NULL, the condition column of the SummarizedExperiment object is used. If "No", no color bar added.)
- label_by
String specifying the column to label the samples (If NULL, the labels column of the SummarizedExperiment object is used. If "No", no labeling of samples done.)
- cluster_samples
Boolean. TRUE if samples should be clustered, else FALSE.
- cluster_proteins
Boolean. TRUE if proteins should be clustered, else FALSE.
- show_row_dend
Boolean. TRUE if row dendrogram should be shown.
- show_column_dend
Boolean. TRUE if column dendrogram should be shown.
- col_vector
Vector of colors for the color bar. If NULL, default colors are used.
Examples
data(tuberculosis_TMT_se)
plot_NA_heatmap(tuberculosis_TMT_se, color_by = NULL,
                label_by = NULL, cluster_samples = TRUE,
                cluster_proteins = TRUE, show_row_dend = TRUE,
                show_column_dend = FALSE,
                col_vector = NULL)
#> Condition of SummarizedExperiment used!
#> Label of SummarizedExperiment used!