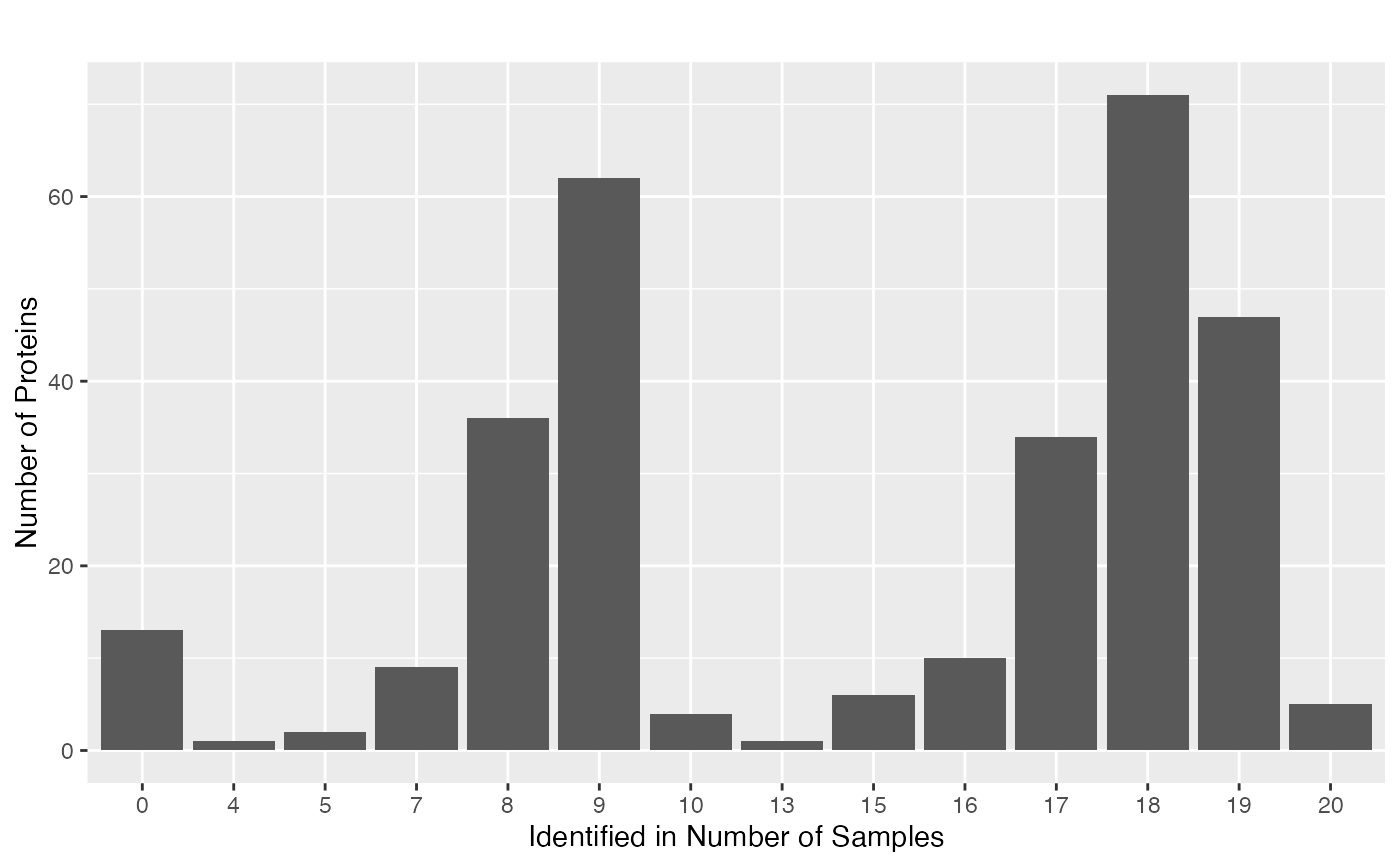
Plot Protein identification overlap (x = Identified in Number of Samples, y=Number of Proteins)
Source:R/FilterProteins.R
plot_NA_frequency.RdPlot Protein identification overlap (x = Identified in Number of Samples, y=Number of Proteins)
Examples
data(tuberculosis_TMT_se)
plot_NA_frequency(tuberculosis_TMT_se)